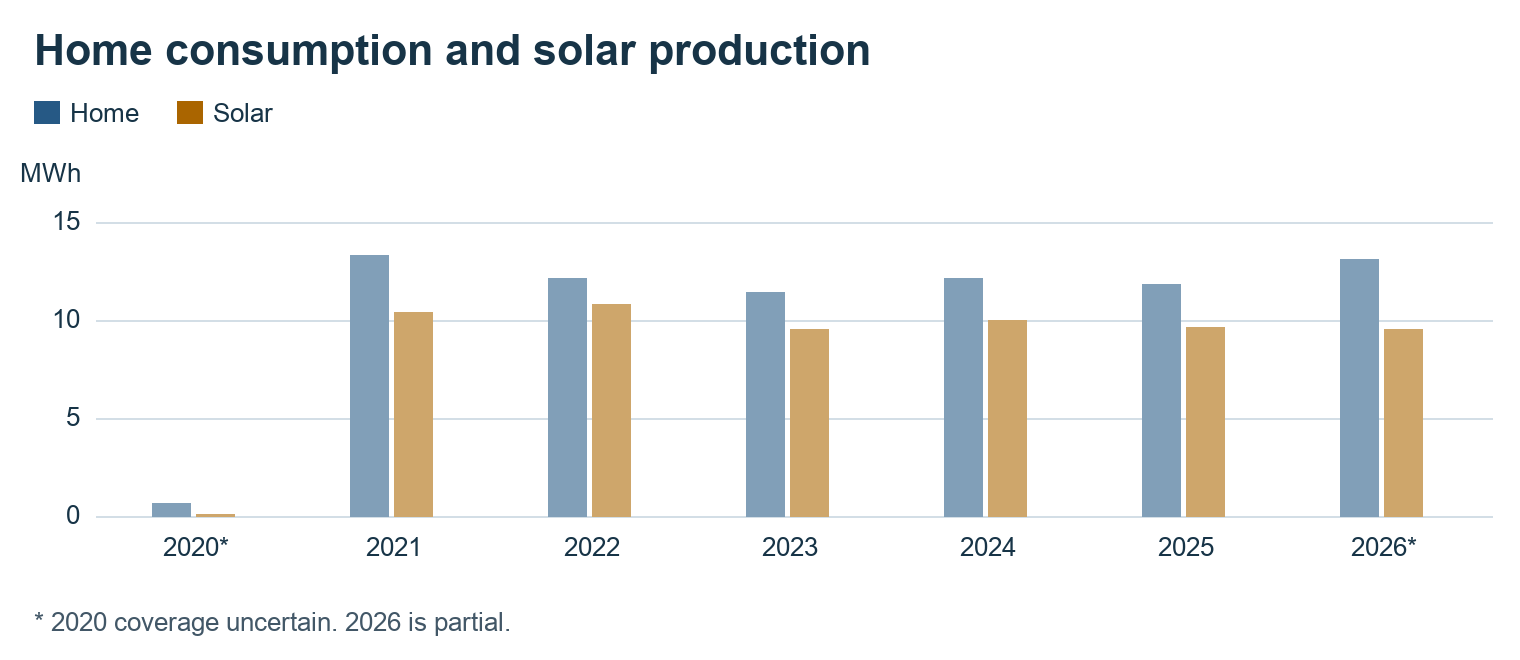
From 2021 through 2025, the home used 60.7 MWh, solar produced 50.3 MWh, and net grid imports totaled 13.1 MWh.
The three Tesla CSVs contained identical annual figures and were counted once. The charts include all seven reported years. The 2020 coverage is uncertain and 2026 is partial, so both are excluded from the five-year summary.
Annual energy flows
Home consumption and solar production
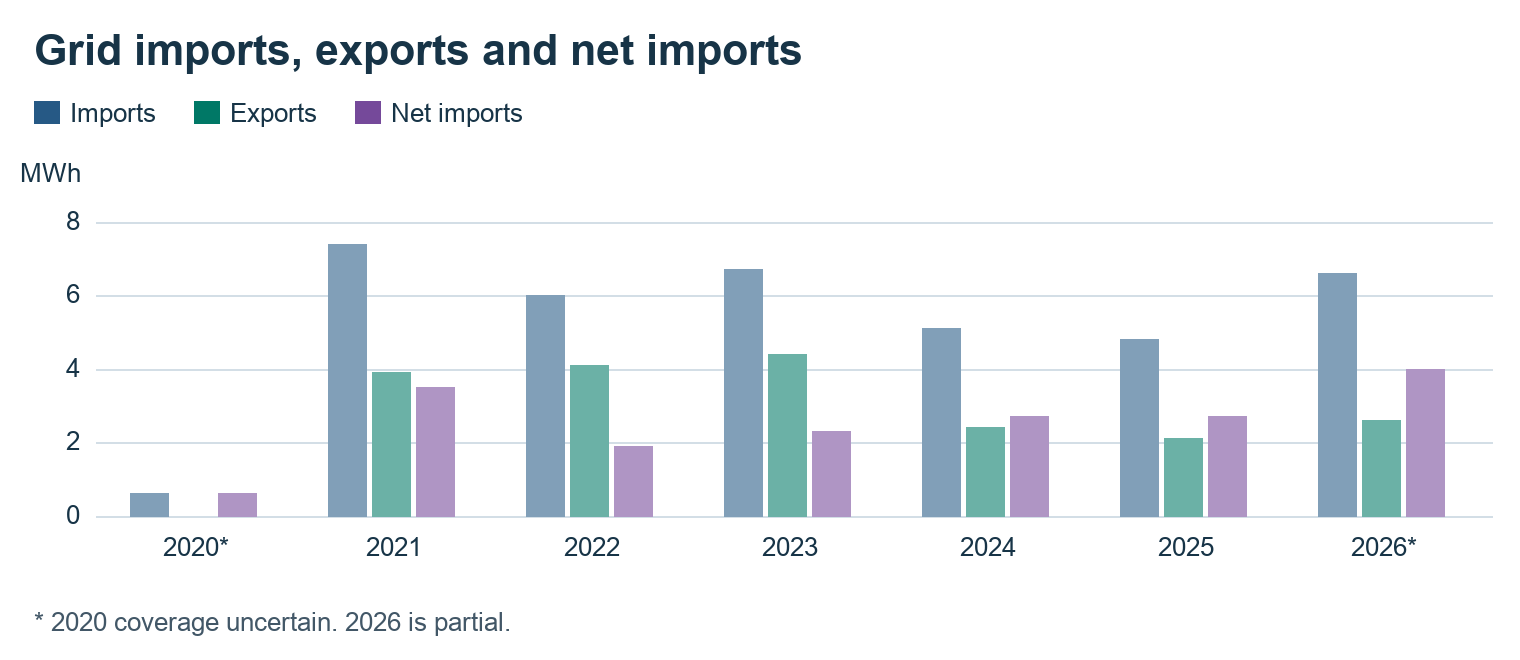
Grid imports, exports and net imports
Energy reported from Powerwall
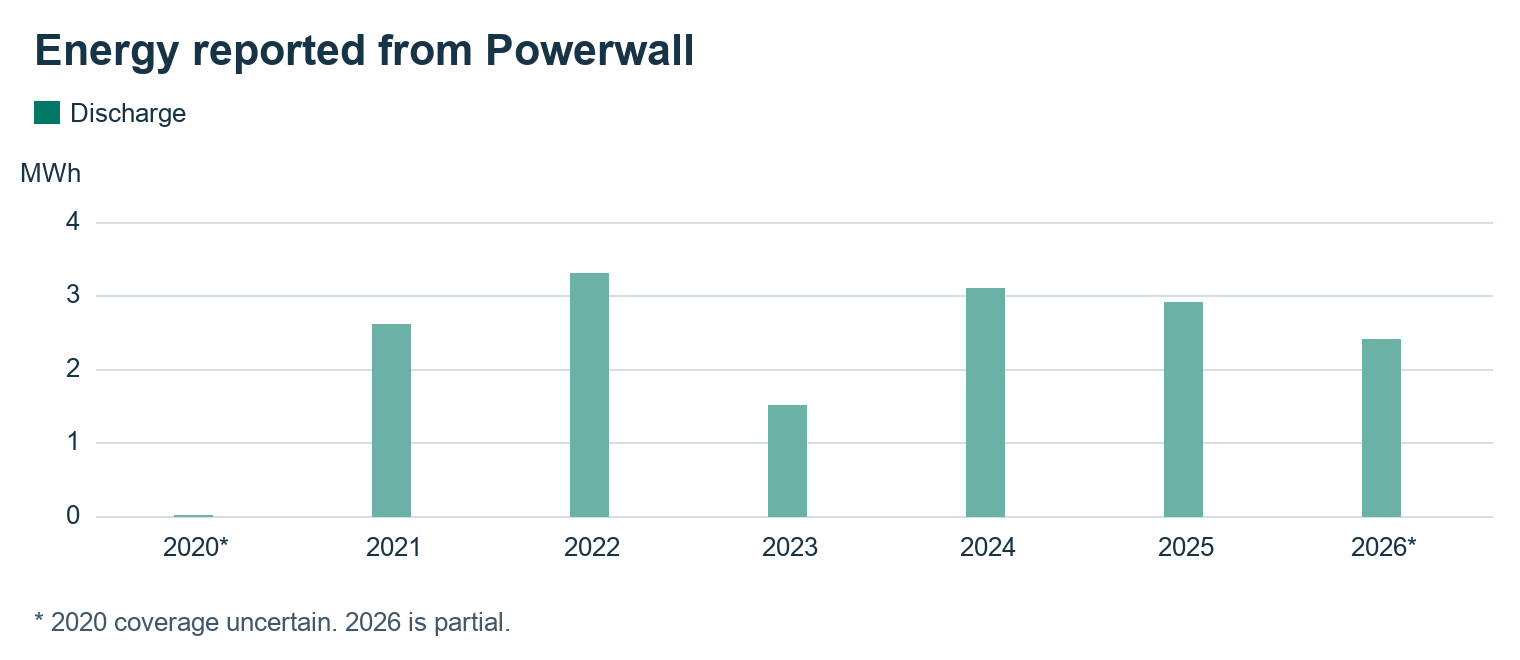
The Powerwall 2 units were recalled in September 2026 and replaced by two Powerwall 3 units in late October 2026, according to the homeowner. The 2026 row spans the replacement and combines both systems. The export reports aggregate discharge. Charging, state of charge, and separate readings for each system are unavailable.
What changed
- Solar production was equivalent to 83% of home consumption by energy volume over 2021–2025. Annual totals cannot show how much solar served the home directly or through storage.
- Grid imports fell from 7.4 MWh in 2021 to 4.8 MWh in 2025, a 35% decline. Exports also fell, from 3.9 to 2.1 MWh, so net imports fell by a smaller 0.8 MWh, from 3.5 to 2.7 MWh. The export does not identify what caused those shifts.
- Before the Powerwall 3 installation, reported battery discharge totaled 13.4 MWh across 2021–2025, ranging from 1.5 MWh in 2023 to 3.3 MWh in 2022. The 2026 row already reports 6.6 MWh imported and 4.0 MWh net imported, both above 2025 totals. The annual figures cannot isolate the effect of the recall or replacement.
How to use this with E-TOU-C
- Establish a Powerwall 3 baseline. Start with the first full day after commissioning. Compare peak import kWh, battery discharge, and charge level at 4 p.m. and 9 p.m. against Powerwall 2 days before the September recall. Match days by weather, solar production, and household use where possible. Treat the recall-to-replacement period separately and check records for any outage or operating restrictions during that period.
- Measure imports from 4–9 p.m. first. E-TOU-C peaks daily, including weekends. Pull 12 months of PG&E interval imports and exports where available. Pair them with Tesla Day exports for representative summer and winter weeks, including signed battery power and charge level where available. Group readings by local Pacific time and compare peak import kWh, battery charge at 4 p.m., and how often it reaches reserve before 9 p.m. The annual CSV has no hour-of-day detail. PG&E TOU plans · Tesla data export
- Shift flexible loads and test battery dispatch. If peak imports are recurring, move EV charging or other flexible loads into solar-rich hours when practical, or after 9 p.m. Check that the Tesla app matches the plan on your bill and test Time-Based Control (Savings mode) at your existing reserve. Compare peak imports across similar weather and usage days. If storage regularly reaches reserve early, use your typical outage loads to decide how much reserve you can spare. Two 13.5 kWh units have 27 kWh of rated storage in total, so each 10 percentage points of reserve represents about 2.7 kWh of rated capacity. Tesla Savings mode · Backup Reserve · Tesla capacity
- Check your export tariff before changing settings. Confirm the generation tier and whether your bill is on legacy NEM or the Solar Billing Plan (NBT). Use the applicable PG&E delivery and 3CE generation charges and export credits to value changes. On NBT, check the hour-specific export value before choosing to discharge to the grid. Confirm permissions before enabling battery export or grid charging. The CSV cannot support a bill-savings estimate. 3CE rates · Legacy NEM · NBT · Tesla export settings
Source values and net imports
All values in MWh. Net imports equal grid imports minus grid exports. Figures use the precision supplied by the export.
| Year | Home | Solar | Discharge | Grid imports | Grid exports | Net imports |
|---|---|---|---|---|---|---|
| 2020* | 0.66 | 0.07 | 0.01 | 0.61 | 0 | 0.61 |
| 2021 | 13.3 | 10.4 | 2.6 | 7.4 | 3.9 | 3.5 |
| 2022 | 12.1 | 10.8 | 3.3 | 6 | 4.1 | 1.9 |
| 2023 | 11.4 | 9.5 | 1.5 | 6.7 | 4.4 | 2.3 |
| 2024 | 12.1 | 10 | 3.1 | 5.1 | 2.4 | 2.7 |
| 2025 | 11.8 | 9.6 | 2.9 | 4.8 | 2.1 | 2.7 |
| 2026* | 13.1 | 9.5 | 2.4 | 6.6 | 2.6 | 4 |
Source files provided in Energy Data · All solar data.csv, All powerwall data.csv, and All grid data.csv.